Loki is a horizontally scalable, highly available, multi-tenant log aggregation system developed by Grafana Labs. LogQL (Log Query Language) is the query language designed specifically for searching Loki log entries.
This note collects common LogQL syntax patterns and examples for quick reference.
Basic LogQL Examples
Query labels
{ filename="/var/log/syslog" }
=equal!=not equal=~regex match!~regex not match
Some regex examples:
{name =~ "mysql.+"}
{name !~ "mysql.+"}
{name !~ `mysql-\d+`}
Labels + content matching
{filename="/var/log/syslog"} |= "Day"
Here, | is the pipeline operator, which passes the previous query result to the next stage. The same equality operators also support string matching, inequality, and regular expressions.
{container="appserver"} |~ "Error | task.err"
Using a Game Server example, this first filters logs from the appserver container, then narrows the result to entries containing ERROR or task.err. Matched content will be highlighted.
If you need several keywords at the same time, chain multiple pipeline filters:
{container="appserver"} |= "task.err" |= "unexpected end of JSON input"
You can also filter by label again after that. Adding node_name = "ip-10-10-3-87.ec2.internal" means the record must come from that specific node:
{container="appserver"} |= "task.err" |= "unexpected end of JSON input" | node_name = "ip-10-10-3-87.ec2.internal"
LogQL Query Structure
Every LogQL query must include a stream selector, meaning the part wrapped in {}. An optional log pipeline can follow it for further filtering.
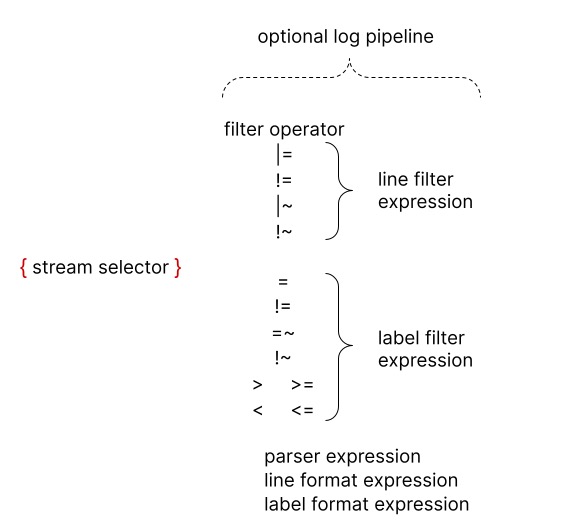
By category, log pipelines can be divided into:
- Filter expressions: line filter expressions and label filter expressions
- Parsing expressions
- Formatting expressions
Filter Expressions
The examples above already showed filter expressions. |= "task.err" is a line filter expression, used after the stream selector to narrow the logs being inspected. node_name = "ip-10-10-3-87.ec2.internal" is a label filter expression, which further reduces the scope.
Line filter expressions
Although line filter expressions can appear anywhere in the log pipeline, it is better to place them at the beginning. Doing so improves query performance because they only continue processing when a line matches. After the log stream selector is applied, line filters are the fastest way to narrow logs.
|=log line contains a string, for example|= "error"!=log line does not contain a string, for example!= "type=ReplicaManager"|~log line matches a regular expression!~log line does not match a regular expression
For regex examples, see the official Line filter expression documentation.
An example that includes error but excludes timeout:
{job="mysql"} |= "error" != "timeout"
Label filter expressions
Label filter expressions let you filter log lines using both original and extracted labels. They can contain multiple predicates.
They support multiple comparison operators and value types, for example:
cluster="namespace"duration > 1mbytes_consumed > 20MBsize == 20kbduration >= 20ms or method="GET" and size <= 20KBduration >= 20ms or (method="GET" and size <= 20KB)
For comparison operators and value types, see the official Label filter expression documentation.
Note: both line and label filters support IP-based matching as well. See the Matching IP addresses section.
Parsing Expressions
Parsing expressions extract labels from log content. For example, given a JSON payload like this:
{ "a.b": {c: "d"}, e: "f" }
A JSON parser can extract labels like:
a_b_c="d"
e="f"
Loki supports these parsers:
- json
- logfmt
- pattern
- regexp
- unpack
JSON parser
There are two forms: | json without arguments, and | json label="expression", another="expression" with arguments.
Start with the no-argument version:
{
    "protocol": "HTTP/2.0",
    "servers": ["129.0.1.1","10.2.1.3"],
    "request": {
        "time": "6.032",
        "method": "GET",
        "host": "foo.grafana.net",
        "size": "55",
        "headers": {
          "Accept": "*/*",
          "User-Agent": "curl/7.68.0"
        }
    },
    "response": {
        "status": 401,
        "size": "228",
        "latency_seconds": "6.031"
    }
}
This produces labels such as:
"protocol" => "HTTP/2.0"
"request_time" => "6.032"
"request_method" => "GET"
"request_host" => "foo.grafana.net"
"request_size" => "55"
"response_status" => "401"
"response_size" => "228"
"response_latency_seconds" => "6.031"
⚠️ The no-argument JSON parser ignores arrays, so the servers field above is skipped.
With the parameterized form, you can extract only the fields you care about from the JSON payload:
| json first_server="servers[0]", ua="request.headers[\"User-Agent\"]"
This extracts servers[0] into the first_server label and request.headers[\"User-Agent\"] into the ua label.
"first_server" => "129.0.1.1"
"ua" => "curl/7.68.0"
If the label name and JSON field name are the same, the expression can be omitted, for example | json servers is equivalent to | json servers="servers".
logfmt parser
Like JSON, logfmt also has parameterized and non-parameterized forms for parsing either part or all of the data.
logfmt is used for logs in the https://brandur.org/logfmt format.
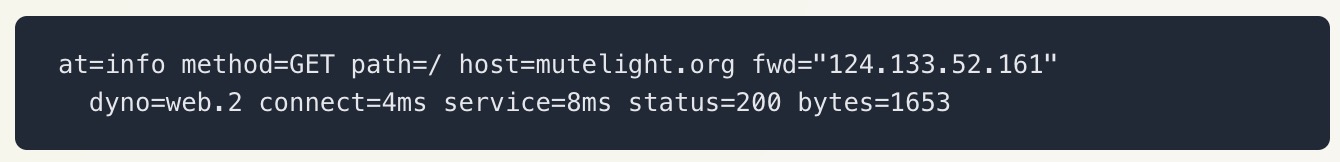
Example log:
at=info method=GET path=/ host=grafana.net fwd="124.133.124.161" service=8ms status=200
It yields these labels:
"at" => "info"
"method" => "GET"
"path" => "/"
"host" => "grafana.net"
"fwd" => "124.133.124.161"
"service" => "8ms"
"status" => "200"
The parameterized form is | logfmt label="expression", another="expression".
This expression extracts the host and fwd fields, renaming fwd to fwd_ip:
| logfmt host, fwd_ip="fwd"
For reference, logfmt supports two flags: --strict and --keep-empty. The first performs stricter validation; in the default permissive mode, malformed fields are ignored, while strict mode returns an error and stops parsing. The second keeps empty-value keys as labels in the no-argument form; when using arguments, selected fields are included without needing --keep-empty.
Examples:
| logfmt --strict
| logfmt --strict host, fwd_ip="fwd"
| logfmt --keep-empty --strict host
Pattern parser
The pattern parser extracts fields explicitly from a log line using a custom expression. Syntax: | pattern "<pattern-expression>"
Take an Nginx log line as an example:
0.191.12.2 - - [10/Jun/2021:09:14:29 +0000] "GET /api/plugins/versioncheck HTTP/1.1" 200 2 "-" "Go-http-client/2.0" "13.76.247.102, 34.120.177.193" "TLSv1.2" "US" ""
It can be parsed with:
<ip> - - <_> "<method> <uri> <_>" <status> <size> <_> "<agent>" <_>
The extracted labels are:
"ip" => "0.191.12.2"
"method" => "GET"
"uri" => "/api/plugins/versioncheck"
"status" => "200"
"size" => "2"
"agent" => "Go-http-client/2.0"
A pattern expression has two parts: captures and literals.
Captures are wrapped in < and >. For example, <example> defines a label named example whose value is the matched text. Literals can be any UTF-8 string or whitespace. Use <_> to ignore content.
By default, the expression matches from the beginning of the log line. If you want to skip some leading content, start the pattern with <_>. Example:
level=debug ts=2021-06-10T09:24:13.472094048Z caller=logging.go:66 traceID=0568b66ad2d9294c msg="POST /loki/api/v1/push (204) 16.652862ms"
Using the expression <_> msg\=" () " skips everything before the msg field and extracts the labels inside msg.
Notes:
- A valid pattern parser must contain at least one named capture
- There must be at least one whitespace separator between two captures; they cannot be adjacent
regexp parser
Unlike json and logfmt, the regexp parser must always take an argument: | regexp "".
The regex is parsed with golang/re2. Each regexp parser must include at least one submatch such as (?P<re>), and every submatch name must be unique.
For example:
| regexp "(?P<method>\\w+) (?P<path>[\\w|/]+) \\((?P<status>\\d+?)\\) (?P<duration>.*)"
Applied to:
POST /api/prom/api/v1/query_range (200) 1.5s
It extracts:
"method" => "POST"
"path" => "/api/prom/api/v1/query_range"
"status" => "200"
"duration" => "1.5s"
If a pattern parser can do the job, it is usually better to use it first, since regex is harder to write and debug.
Tip:
To avoid escaping special characters you can use the `(backtick) instead of " when quoting strings. For example
\w+is the same as "\w+". This is specially useful when writing a regular expression which contains multiple backslashes that require escaping.
unpack parser
Used together with pack. After promtail’s pack stage puts the log into _entry:
{
  "container": "myapp",
  "pod": "pod-3223f",
  "_entry": "original log message"
}
The unpack parser can restore labels from the packed log. In this example, it extracts the container and pod labels, while replacing the special _entry field with the log line. After unpacking, it is usually combined with json or logfmt for further processing of the original log message.
Line Format Expressions
The line_format expression rewrites log output.
It follows the text/template format, with the structure:
| line_format "{{.label_name}}"
All labels are injected into the template and can be used directly. For example:
{container="frontend"} | logfmt | line_format "{{.query}} {{.duration}}"
This rewrites the log so that only the query and duration label values remain. If you need a more complex template, use a backtick instead of double quotes to avoid syntax issues.
line_format also supports math functions. Given data like this:
ip=1.1.1.1, status=200 and duration=3000(ms)
Processed with:
{container="frontend"} | logfmt | line_format "{{.ip}} {{.status}} {{div .duration 1000}}"
The output becomes:
1.1.1.1 200 3
Label Formatting Expressions
Add or modify labels
Use | label_format to rename, modify, or add labels. Multiple operations can be separated by commas.
When both sides of the equal sign are labels, dst=src renames src to dst. When the right side is a template, dst="{{.status}} {{.query}}", the value of dst is replaced; if dst does not exist, it is created. The template syntax is the same as what line_format supports.
If you do not want dst=src to destroy the source label during assignment, use dst="{{.src}}".
One more note: a single expression cannot modify the same label more than once: | label_format foo=bar,foo="new" ⚠️
Drop labels
The drop keyword removes labels. Syntax: |drop name, other_name, some_name="some_value"
Sample data:
{"level": "info", "method": "GET", "path": "/", "host": "grafana.net", "status": "200"}
Expression:
{job="varlogs"} | json | drop level, method="GET"
Remaining labels:
"path" => "/"
"host" => "grafana.net"
"status" => "200"
Keep labels
| keep keeps only the specified labels and removes all others. Syntax: |keep name, other_name, some_name="some_value"
Sample data:
{"level": "info", "method": "GET", "path": "/", "host": "grafana.net", "status": "200"}
{"level": "info", "method": "POST", "path": "/", "host": "grafana.net", "status": "200"}
Expression:
{job="varlogs"} | json | keep level, method="GET"
Labels:
level => "info"
method =>"GET"
{"level": "info", "method": "GET", "path": "/", "host": "grafana.net", "status": "200"}

level => "info"
{"level": "info", "method": "POST", "path": "/", "host": "grafana.net", "status": "200"}
A Practical Example
Suppose the log looks like this:
2024-04-01T10:09:04.060Z ERROR task_scheduler/task_scheduler.go:54 task.err {"app_name": "mars", "server": "appserver", "name": "activity.update_remote_config", "err": "unexpected end of JSON input", "task_duration": "4.820625ms"}
The useful content is inside the final JSON payload. The following two methods can be used to parse it into labels.
Pattern matching
First, use pattern matching. This is the recommended and more convenient approach:
{container="appserver"} |= "task.err" | pattern "<datatime>\t<log_level>\t<func>\t<msg>\t<json_payload>" | line_format "{{.json_payload}}" | json
Regular expression matching
{container="appserver"} |= "task.err" |= "unexpected end of JSON input" | regexp "(?P<datatime>[^\\s]+)\\t(?P<level>[\\w]+)\\t(?P<func_line>[^\\s]+)\\t(?P<msg>[^\\s]+)\\t(?P<json_payload>.*)" | line_format "{{.json_payload}}" | json
The result is the same as with pattern matching. The labels generated from the JSON content are shown below:
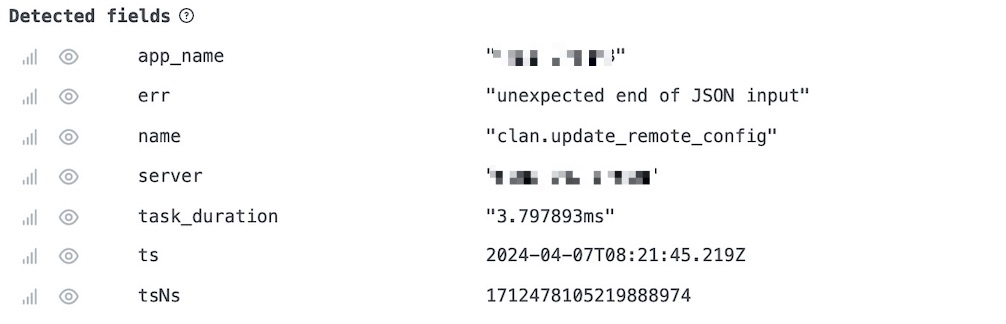
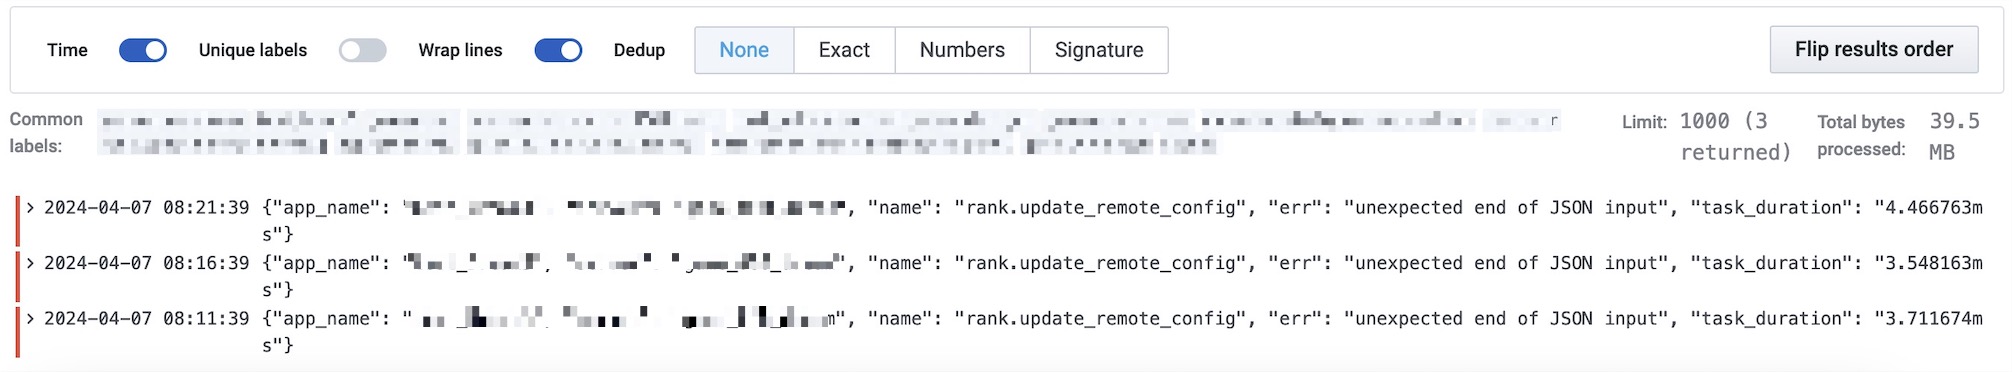
Filtering by label
Based on the query above, you can filter again using a label:
| name = "rank.update_remote_config"
This filters records whose name field inside the JSON is rank.update_remote_config.
Reference
- Grafana official log_queries documentation