Data and comparability
The figures used here come from annual datasets released by China’s Ministry of Education. Only a small part of the available material is needed for this analysis. One complication is that the ministry’s tables are not fully consistent across years: reporting formats changed, and some statistical definitions were revised. Where those changes affect interpretation, they matter more than the raw trend line.
## 研究生数据
graduate <- read.csv('https://raw.githubusercontent.com/yufree/sciguide/master/data/graduate.csv', check.names = F)
## 教职数据
faculty <- read.csv('https://raw.githubusercontent.com/yufree/sciguide/master/data/faculty.csv', check.names = F)
Graduate enrollment is still expanding
After the expansion of undergraduate higher education, graduate enrollment became another national-level version of the story that education changes one’s fate. The college entrance examination can no longer expand in the same way. With policy requirements around secondary vocational education, roughly half of the relevant age cohort may be directed toward vocational tracks, while most of the rest are absorbed by regular high schools. The higher education enrollment rate has largely stabilized. For those who still cannot enter, it may simply mean that academic schooling is not the suitable path.
But selective pressure does not disappear; it only moves. Once the filtering function of the gaokao becomes less decisive, the postgraduate entrance examination naturally becomes the next battlefield.
The first thing to look at is scale. The graduate student population has been growing for the entire period, and the pace has picked up in recent years.
graduate2 <- graduate[graduate$category == 'Total',]
# 人数
library(showtext)
showtext::showtext_auto()
par(mfrow=c(1,2))
plot(graduate2$year,graduate2$`Enrolment(Master)`,xlab = '年份',ylab = '人数',pch=19,col='black',ylim=c(min(graduate2$`Admitted(Master)`),max(graduate2$`Enrolment(Master)`)),main='硕士研究生')
points(graduate2$year,graduate2$`Graduates(Master)`,pch=19,col = 'red')
points(graduate2$year,graduate2$`Admitted(Master)`,pch=19,col='blue')
segments(graduate2$year[-c(22:24)],graduate2$`Admitted(Master)`[-c(22:24)],graduate2$year[-c(22:24)]+3,graduate2$`Graduates(Master)`[-c(1:3)])
legend('topleft',legend = c('在校生','录取人数','毕业人数'), col = c('black','blue','red'),pch=19)

plot(graduate2$year,graduate2$`Enrolment(Doctor)`,xlab = '年份',ylab = '人数',pch=19,col='black',ylim=c(min(graduate2$`Entrants(Doctor)`),max(graduate2$`Enrolment(Doctor)`)),main='博士研究生')
points(graduate2$year,graduate2$`Graduates(Doctor)`,pch=19,col = 'red')
points(graduate2$year,graduate2$`Entrants(Doctor)`,pch=19,col='blue')
segments(graduate2$year[-c(20:24)],graduate2$`Entrants(Doctor)`[-c(20:24)],graduate2$year[-c(20:24)]+5,graduate2$`Graduates(Doctor)`[-c(1:5)])
legend('topleft',legend = c('在校生','录取人数','毕业人数'), col = c('black','blue','red'),pch=19)
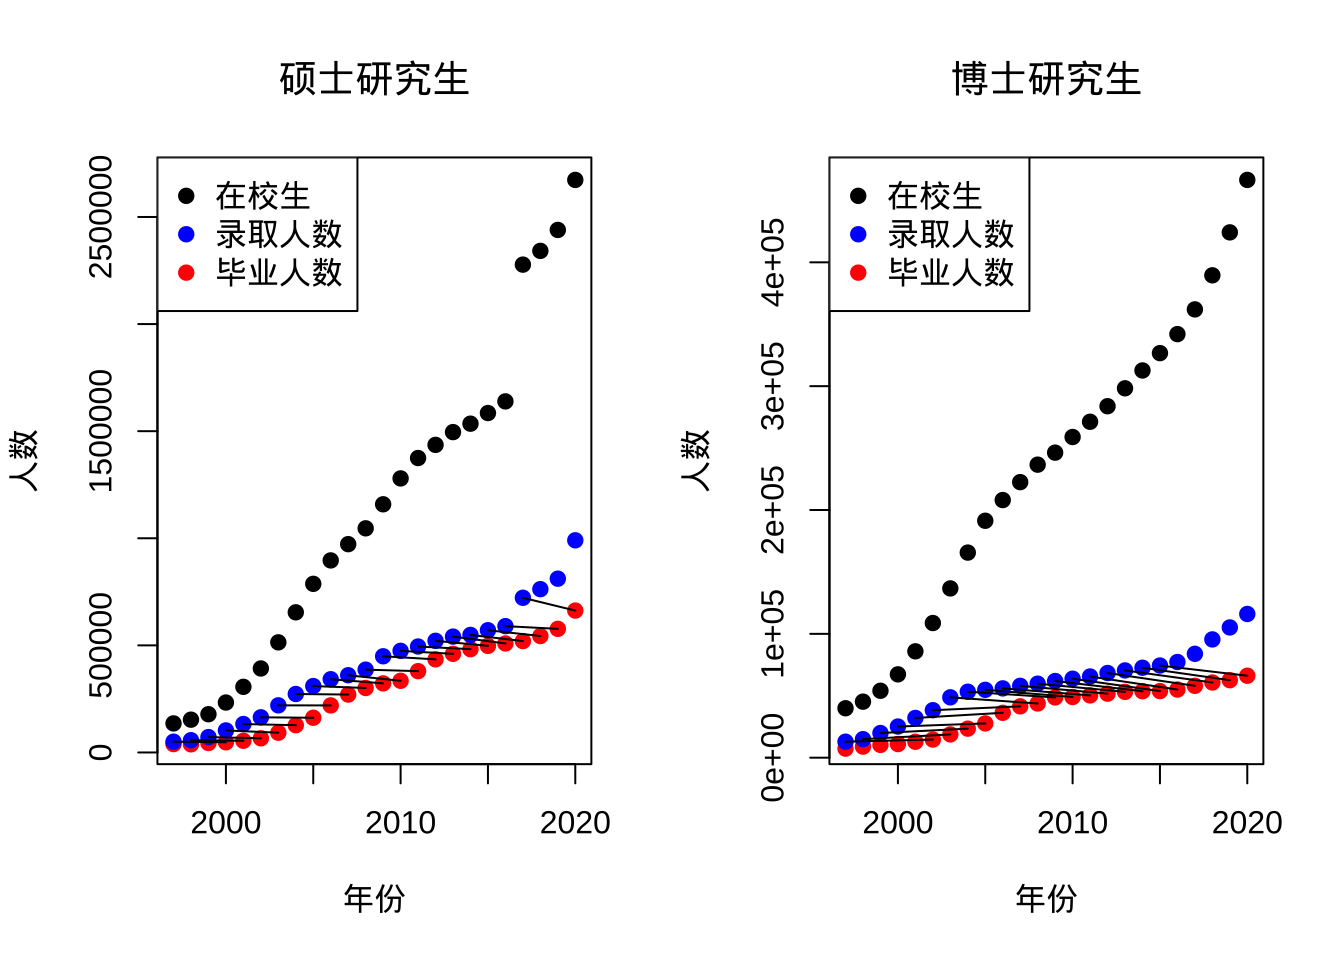
The sudden jump in master’s student numbers around 2017 should not be read too literally as a pure enrollment shock. The Ministry of Education changed its statistical definitions that year. Admissions began to include both full-time and part-time graduate students; enrollment and degree-award figures also began to include full-time students, part-time students, and in-service students pursuing master’s degrees.
Even allowing for that break in the series, the scale is already large. China now has about 2.5 million enrolled master’s students and close to 500,000 doctoral students. Annual admissions are approaching 1 million for master’s programs and 100,000 for doctoral programs. The master-to-doctor ratio is roughly stable at around 10:1.
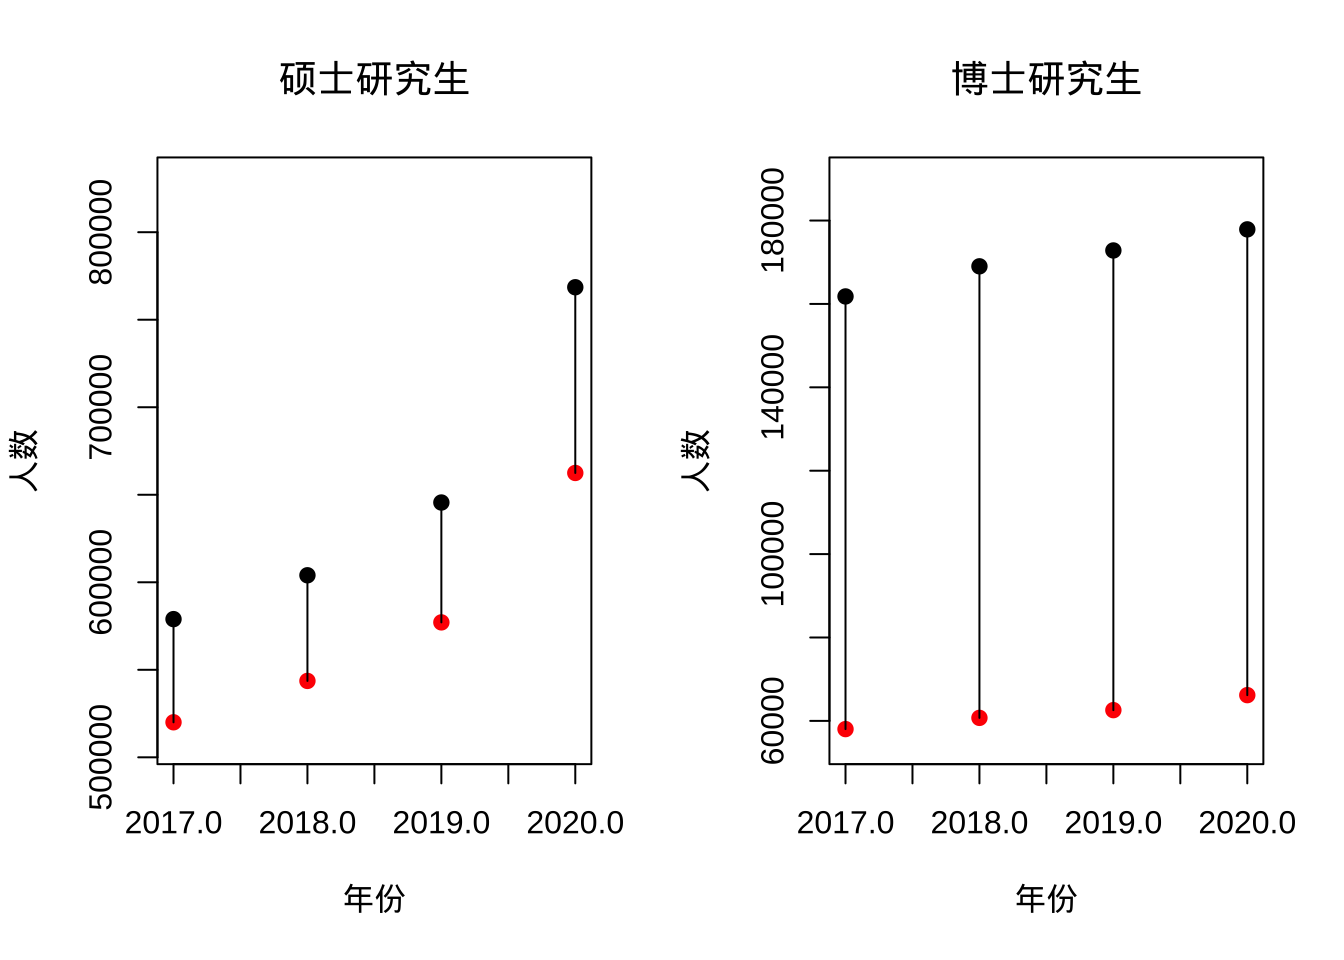
The next issue is delayed graduation. In the first chart, admissions are connected to master’s graduates three years later and doctoral graduates five years later. Master’s students do not show much delay by that rough measure. Doctoral students are different: in recent years the connecting lines slope downward, which means delayed graduation is widespread.
graduate3 <- graduate2[!is.na(graduate2$`Estimated Graduates for Next Year (master)`),]
par(mfrow=c(1,2))
plot(graduate3$year[-1],graduate3$`Estimated Graduates for Next Year (master)`[-5],xlab = '年份',ylab = '人数',pch=19,col='black',xlim = c(2017,2020), ylim=c(min(graduate3$`Graduates(Master)`),max(graduate3$`Estimated Graduates for Next Year (master)`)),main='硕士研究生')
points(graduate3$year[-1],graduate3$`Graduates(Master)`[-1],pch=19,col = 'red')
segments(graduate3$year[-1],graduate3$`Estimated Graduates for Next Year (master)`[-5],graduate3$year[-1],graduate3$`Graduates(Master)`[-1],pch=19)
plot(graduate3$year[-1],graduate3$`Estimated Graduates for Next Year (Doctor)`[-5],xlab = '年份',ylab = '人数',pch=19,col='black',xlim = c(2017,2020), ylim=c(min(graduate3$`Graduates(Doctor)`),max(graduate3$`Estimated Graduates for Next Year (Doctor)`)),main='博士研究生')
points(graduate3$year[-1],graduate3$`Graduates(Doctor)`[-1],pch=19,col = 'red')
segments(graduate3$year[-1],graduate3$`Estimated Graduates for Next Year (Doctor)`[-5],graduate3$year[-1],graduate3$`Graduates(Doctor)`[-1],pch=19)
# 平均延期概率
mean(graduate3$`Graduates(Master)`[-1]/graduate3$`Estimated Graduates for Next Year (master)`[-5])
## [1] 0.8885
mean(graduate3$`Graduates(Doctor)`[-1]/graduate3$`Estimated Graduates for Next Year (Doctor)`[-5])
## [1] 0.363
There are limits to the simple three-year and five-year comparison. Many master’s programs are actually two-year programs, and doctoral completion time is harder to define because some students enter through combined master-doctor tracks. Fortunately, in the most recent five years the ministry also reported estimated graduates for the following year, allowing a more direct comparison between expected and actual completions.
For the most recent four years shown, about 11% of master’s students failed to graduate on schedule, while the figure for doctoral students was about 64%. In other words, whether one studies for a master’s or a doctorate, the probability of not finishing on time is already above one in ten. The number of master’s students delayed each year is roughly comparable to that year’s doctoral intake, which is an irony of its own.
Expansion looks very different by discipline
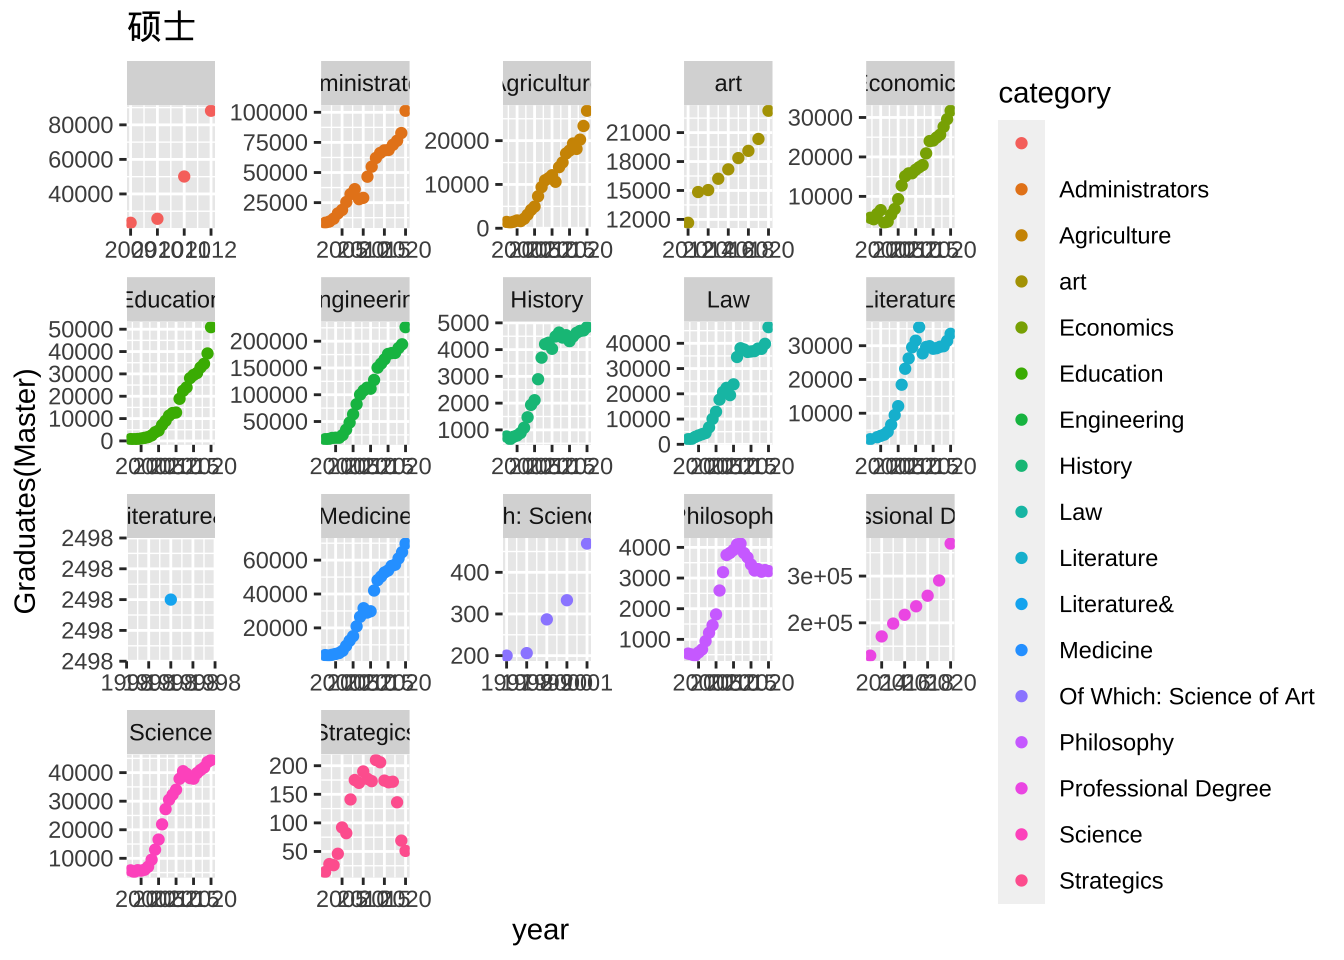
The overall increase hides major differences across fields. At the master’s level, professional degrees, management, medicine, and engineering have grown quickly. Humanities fields have not expanded much. Military science and philosophy have even declined, while science has grown only modestly.
At the doctoral level, the biggest and fastest-growing fields are science, engineering, and medicine. Most other disciplines have seen little expansion over the past decade.
graduate2 <- graduate[graduate$category != "Total"&graduate$category !="Of Which: Female",]
graduate2 <- graduate2[complete.cases(graduate2[,c(1:11)]),]
library(ggplot2)
ggplot(graduate2,aes(year,`Graduates(Master)`,color = category)) +
        geom_point()+
        facet_wrap(facets = vars(category),scales = 'free')+
        ggtitle('硕士')
ggplot(graduate2,aes(year,`Graduates(Doctor)`,color = category)) +
        geom_point()+
        facet_wrap(facets = vars(category),scales = 'free')+
        ggtitle('博士')
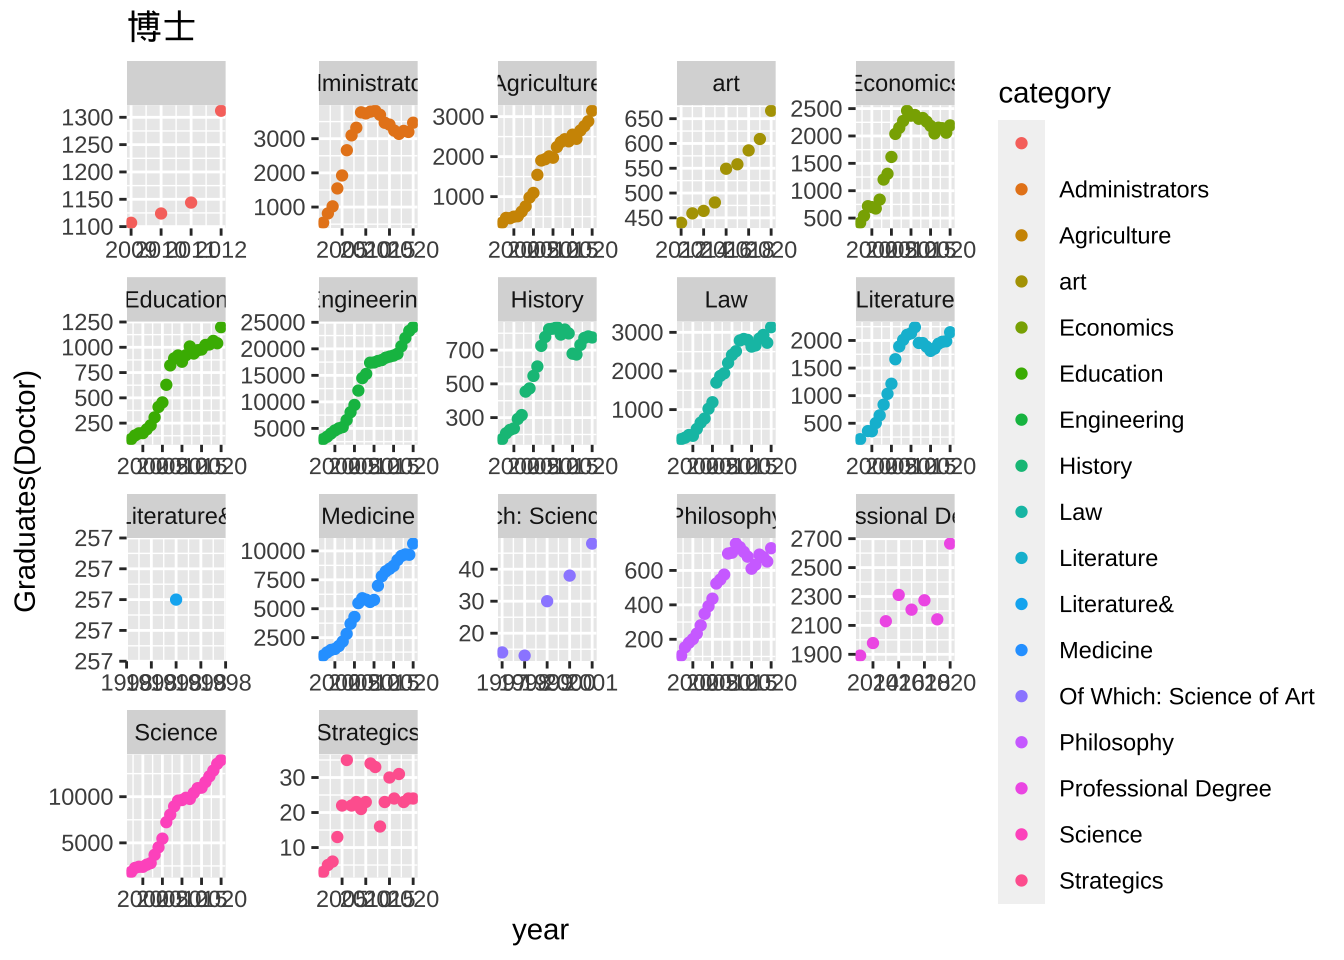
Comparing master’s and doctoral patterns is revealing. Management and economics produce many master’s graduates, but not many doctoral graduates. One likely explanation is that a master’s degree in these fields is already employable enough. In fields where master’s growth is limited but doctoral growth is substantial, such as science, the implication is different: these are basic disciplines where a doctorate may be needed for employment.
If both master’s and doctoral numbers rise quickly, as in agriculture or the arts, the interpretation is less flattering. It may reflect strong national demand, but it may also mean employment is difficult at both levels.
The rapid growth of professional master’s degrees suggests that the system has recognized demand for applied graduate training. The emergence of professional doctoral degrees points in the same direction: even applied work is demanding more advanced knowledge.
Faculty positions: growth, but not enough of the right kind
After looking at graduate students, the natural next question is faculty employment. The data used here mainly come from the ministry’s dataset on graduate supervisors. In China today, entering a faculty position without a doctoral degree is basically no longer realistic, so the employment prospects of master’s graduates inside academia are not the focus.
par(mfrow=c(1,2))
plot(faculty$year[faculty$category == 'Total'],faculty$total[faculty$category == 'Total'],pch=19, main='教职数',ylim=c(0,max(faculty$total)),xlab = '年份', ylab = '人数', type = 'o')
points(faculty$year[faculty$category == 'Professors'], faculty$total[faculty$category == 'Professors'],pch=19,col='blue', type = 'o')
points(faculty$year[faculty$category == 'Asso. Professors'],faculty$total[faculty$category == 'Asso. Professors'],pch=19,col='red', type = 'o')
points(faculty$year[faculty$category == 'middle'],faculty$total[faculty$category == 'middle'],pch=19,col='orange', type = 'o')
legend('topleft',legend = c('总数','教授','副教授','中级职称'), col = c('black','blue','red','orange'),pch=19)
plot(faculty$year[faculty$category == "Supervisors of master's degree prog."],faculty$total[faculty$category == "Supervisors of master's degree prog."],pch=19, main='教职数',ylim=c(0,400000),xlab = '年份', ylab = '人数', type = 'o')
points(faculty$year[faculty$category == 'Supervisors of doctoral programmes'], faculty$total[faculty$category == 'Supervisors of doctoral programmes'],pch=19,col='blue', type = 'o')
points(faculty$year[faculty$category == 'Supervisors of doc. & mas. Degree programmes'],faculty$total[faculty$category == 'Supervisors of doc. & mas. Degree programmes'],pch=19,col='red', type = 'o')
legend('topleft',legend = c('硕士导师','博士导师','硕士博士导师'), col = c('black','blue','red'),pch=19)
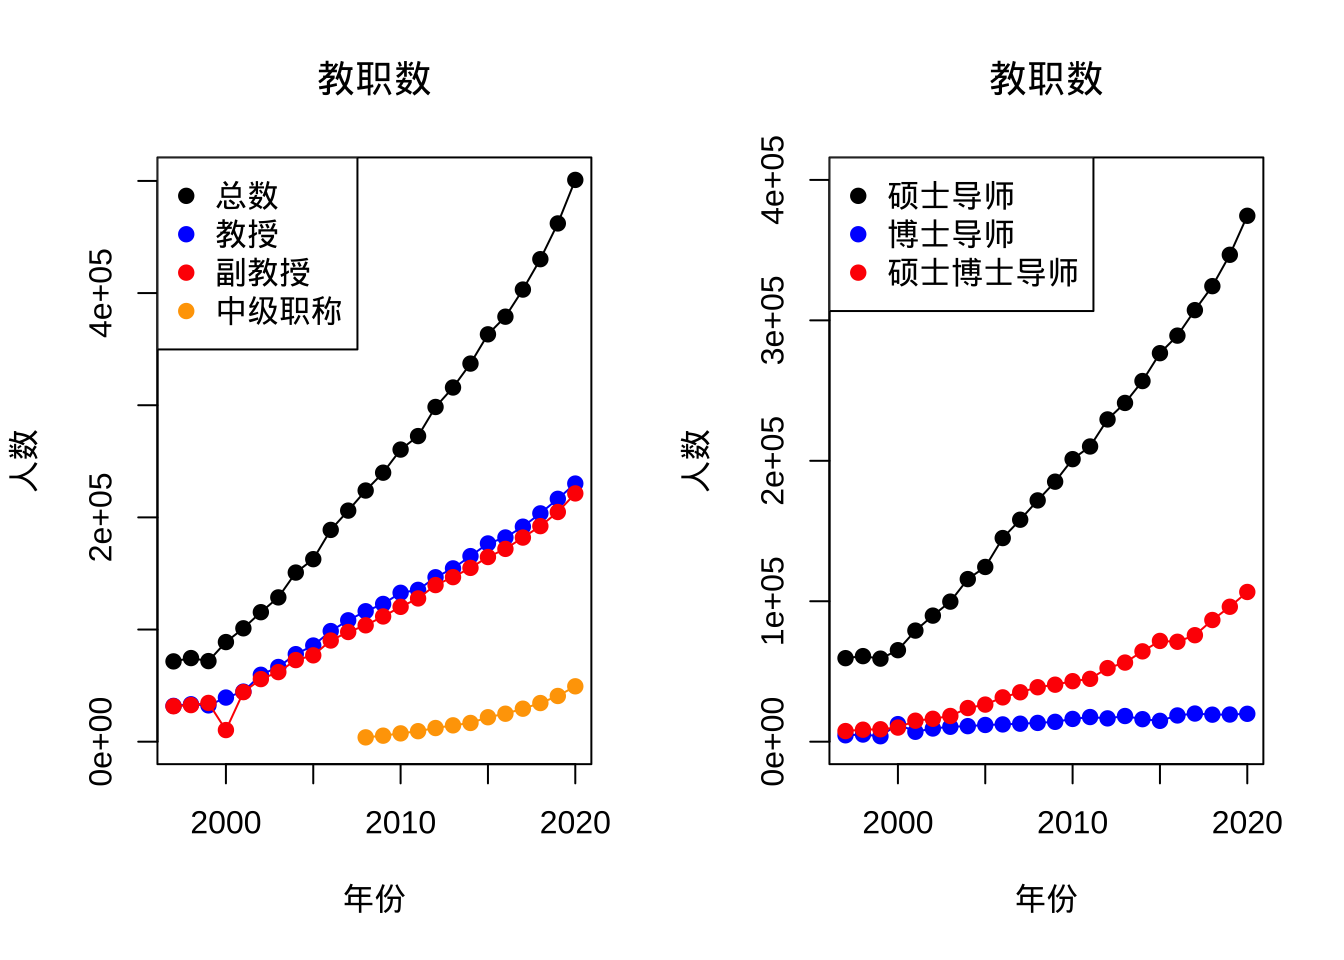
Since undergraduate enrollment began expanding in 1999, the number of faculty members has also risen. But senior titles have grown much more slowly than the total number of faculty positions, while mid-level titles have increased rapidly. Both professors and associate professors have increased, and the number of professors is even larger than the number of associate professors.
Supervisor status tells another story. The number of master’s supervisors has risen very fast, while the number of doctoral supervisors has been roughly stable at about 20,000. One caveat is that Chinese faculty systems are currently being reformed toward pre-tenure and tenure-style arrangements, so the distinction between master’s and doctoral supervisors may matter less in the future.
The 1999 expansion left an age bulge
faculty2 <- faculty[faculty$category == 'Total', ]
par(mfrow=c(1,1))
col = RColorBrewer::brewer.pal(8,'Set2')
plot(faculty2$year,faculty2$`30 Years & Under`,pch=19, main='教职数',ylim=c(0,110000),xlab = '年份', ylab = '人数',col=col[1], type = 'o')
points(faculty2$year,faculty2$`31-35years`,pch=19,col=col[2], type = 'o')
points(faculty2$year,faculty2$`36-40years`,pch=19,col=col[3], type = 'o')
points(faculty2$year,faculty2$`41-45years`,pch=19,col=col[4], type = 'o')
points(faculty2$year,faculty2$`46-50years`,pch=19,col=col[5], type = 'o')
points(faculty2$year,faculty2$`51-55years`,pch=19,col=col[6], type = 'o')
points(faculty2$year,faculty2$`56-60years`,pch=19,col=col[7], type = 'o')
points(faculty2$year,faculty2$`61 Years & Over`,pch=19,col=col[8], type = 'o')
legend('topleft',legend = c('30岁以下','30-34','35-39','40-44','45-49','50-54','55-59','60岁以上'), col = col,pch=19)
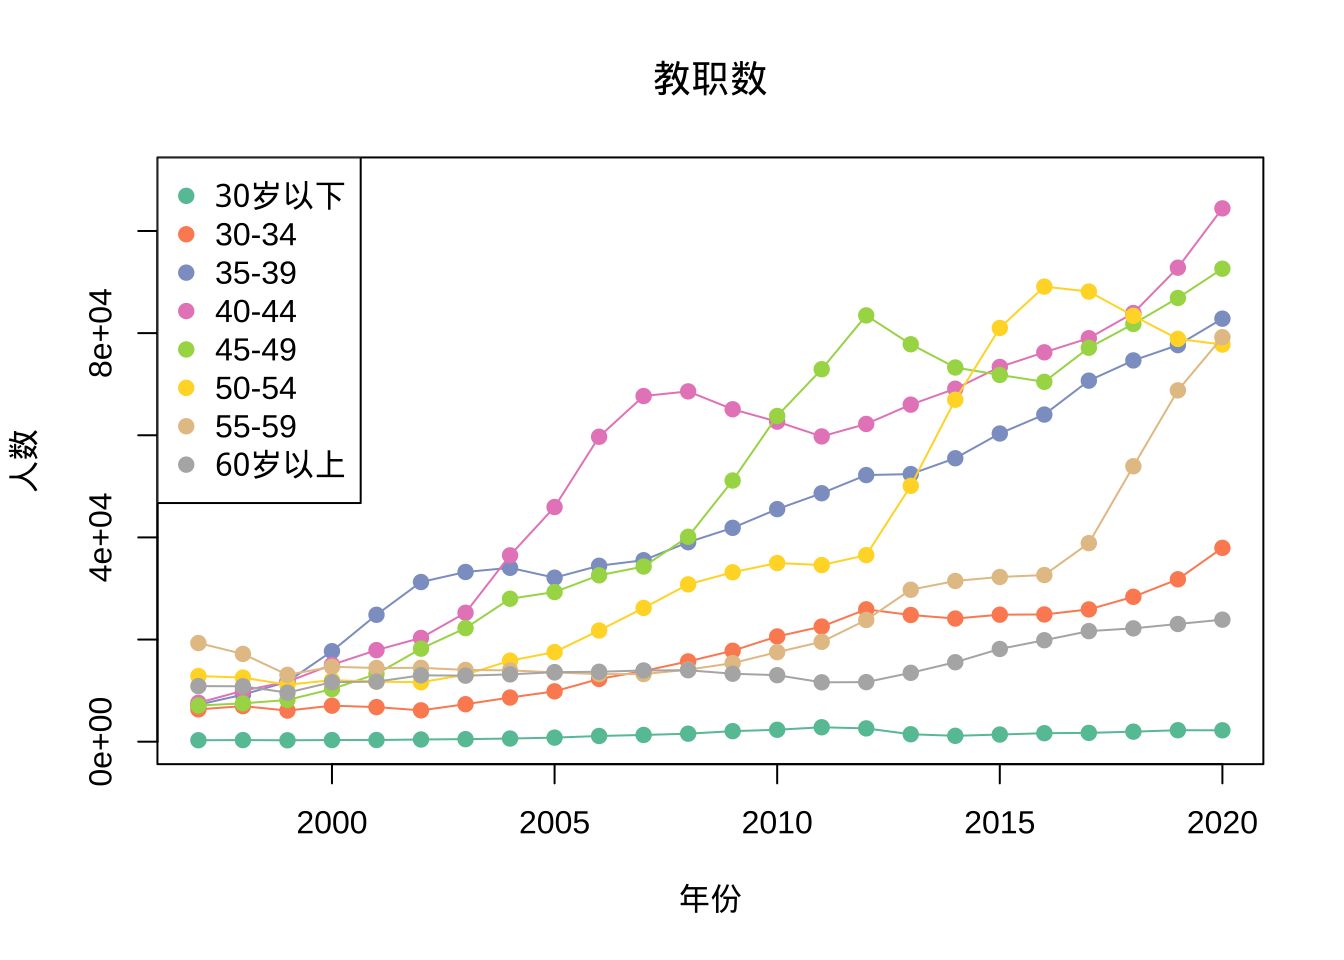
The age-distribution data for 1997 to 2013 use the following bands: 30 and under, 31-35, 36-40, 41-45, 46-50, 51-55, 56-60, and over 60.
A clear bump appears in the 35-39 age group after the 1999 university expansion. That was the era when, in many cases, finishing a doctorate was enough to obtain a faculty position. Every five years, the same bump shifts forward by one age band. It has now moved into the 55-59 group.
If the retirement age is not extended, the next five to ten years could produce a vacancy window caused by retirement. At present, senior faculty openings seem to be on the order of 20,000 to 30,000 per year; when that age bulge retires, the number could roughly double. But the more likely outcome is that retirement ages will be extended. If so, the people who can actually catch this vacancy window may still be in secondary school now, or they already need to be at least in a mid-level faculty position waiting in line. A few years later, China’s academic job market may become one person per slot in the most literal sense.
par(mfrow=c(1,3))
faculty2 <- faculty[faculty$category == 'Professors', ]
plot(faculty2$year,faculty2$`30 Years & Under`,pch=19, main='教授',ylim=c(0,80000),xlab = '年份', ylab = '人数',col=col[1], type = 'o')
points(faculty2$year,faculty2$`31-35years`,pch=19,col=col[2], type = 'o')
points(faculty2$year,faculty2$`36-40years`,pch=19,col=col[3], type = 'o')
points(faculty2$year,faculty2$`41-45years`,pch=19,col=col[4], type = 'o')
points(faculty2$year,faculty2$`46-50years`,pch=19,col=col[5], type = 'o')
points(faculty2$year,faculty2$`51-55years`,pch=19,col=col[6], type = 'o')
points(faculty2$year,faculty2$`56-60years`,pch=19,col=col[7], type = 'o')
points(faculty2$year,faculty2$`61 Years & Over`,pch=19,col=col[8], type = 'o')
legend('topleft',legend = c('30岁以下','30-34','35-39','40-44','45-49','50-54','55-59','60岁以上'), col = col,pch=19)

faculty2 <- faculty[faculty$category == 'Asso. Professors', ]
plot(faculty2$year,faculty2$`30 Years & Under`,pch=19, main='副教授',ylim=c(0,80000),xlab = '年份', ylab = '人数',col=col[1], type = 'o')
points(faculty2$year,faculty2$`31-35years`,pch=19,col=col[2], type = 'o')
points(faculty2$year,faculty2$`36-40years`,pch=19,col=col[3], type = 'o')
points(faculty2$year,faculty2$`41-45years`,pch=19,col=col[4], type = 'o')
points(faculty2$year,faculty2$`46-50years`,pch=19,col=col[5], type = 'o')
points(faculty2$year,faculty2$`51-55years`,pch=19,col=col[6], type = 'o')
points(faculty2$year,faculty2$`56-60years`,pch=19,col=col[7], type = 'o')
points(faculty2$year,faculty2$`61 Years & Over`,pch=19,col=col[8], type = 'o')
legend('topleft',legend = c('30岁以下','30-34','35-39','40-44','45-49','50-54','55-59','60岁以上'), col = col,pch=19)

faculty2 <- faculty[faculty$category == 'middle', ]
plot(faculty2$year,faculty2$`30 Years & Under`,pch=19, main='中级职称',ylim=c(0,30000),xlab = '年份', ylab = '人数',col=col[1], type = 'o')
points(faculty2$year,faculty2$`31-35years`,pch=19,col=col[2], type = 'o')
points(faculty2$year,faculty2$`36-40years`,pch=19,col=col[3], type = 'o')
points(faculty2$year,faculty2$`41-45years`,pch=19,col=col[4], type = 'o')
points(faculty2$year,faculty2$`46-50years`,pch=19,col=col[5], type = 'o')
points(faculty2$year,faculty2$`51-55years`,pch=19,col=col[6], type = 'o')
points(faculty2$year,faculty2$`56-60years`,pch=19,col=col[7], type = 'o')
points(faculty2$year,faculty2$`61 Years & Over`,pch=19,col=col[8], type = 'o')
legend('topleft',legend = c('30岁以下','30-34','35-39','40-44','45-49','50-54','55-59','60岁以上'), col = col,pch=19)
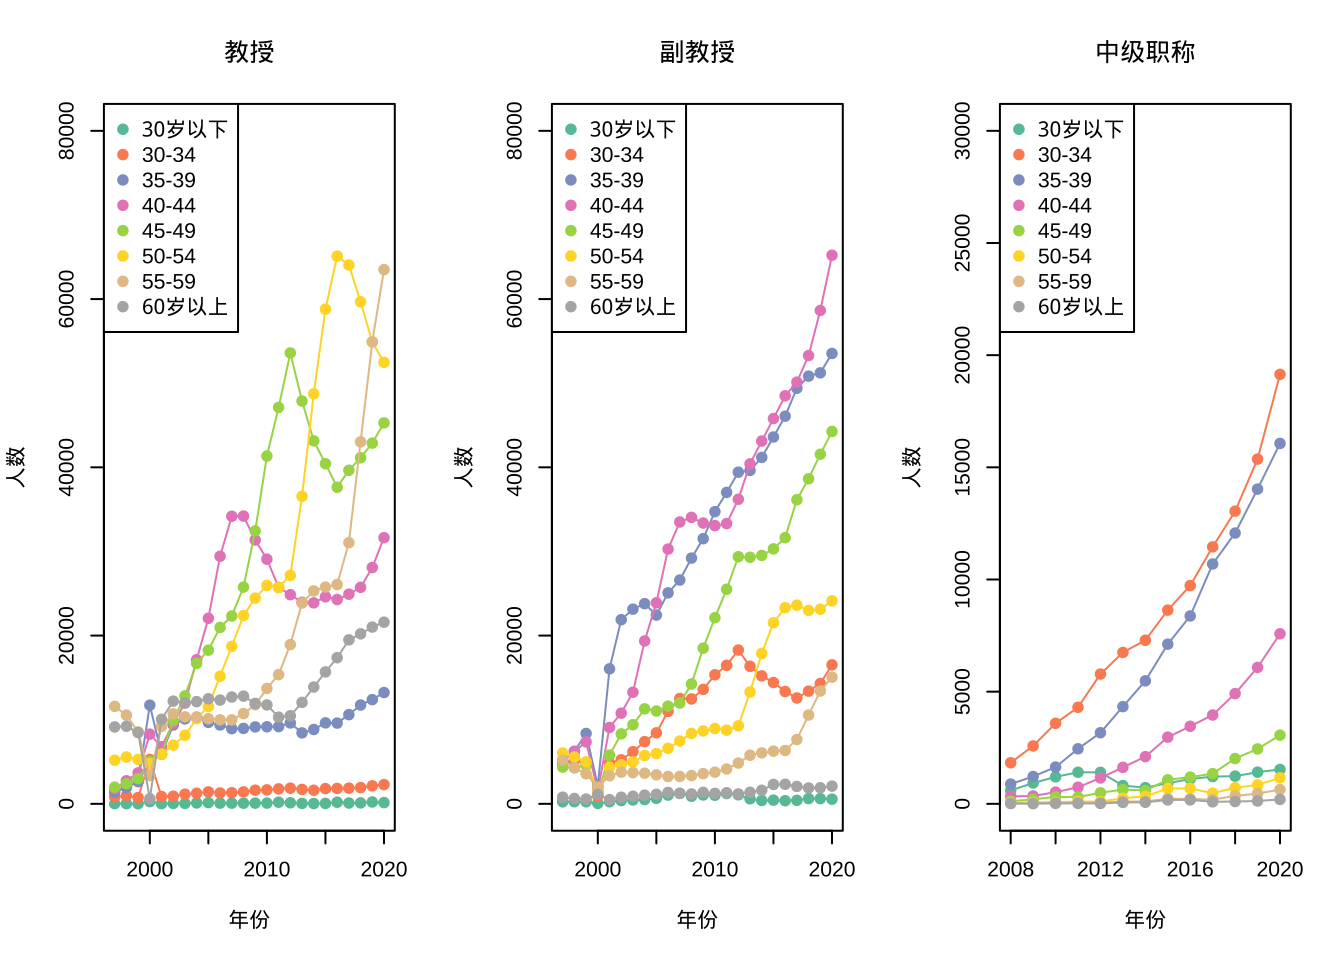
Looking more closely at the age structure created by the 1999 expansion, the cohort in that bulge is mostly professors. Twenty years ago, it was still possible in many places to move up by accumulating years in the system. That path is now visibly blocked at the associate professor level. Younger faculty in both professor and associate professor categories have increased, and the mid-level group is still growing fast.
The data also suggest a hard career boundary around ages 40-44. If someone has not become a professor or associate professor by then, the chance of moving up later appears low. Current national talent programs also tend to draw lines around age 40 or 45.
From the employment side, China graduates about 100,000 doctoral students per year. Mid-level faculty positions increase by roughly 20,000 per year. Some newly graduated PhDs, including postdocs, can still obtain senior titles, and that channel is also probably on the scale of 20,000 to 30,000 per year. Taken together, the faculty market can absorb at most about half of each year’s doctoral graduates.
Because undergraduate enrollment is no longer expanding dramatically, a major new wave of faculty hiring is unlikely. Since doctoral enrollment is still expanding, more doctoral graduates will be sent directly into non-academic society.
Main takeaways
- Graduate expansion is still underway. The total graduate student population is around 3 million, and annual additions are now on the scale of one million.
- About one in ten master’s students are delayed, while more than 60% of doctoral students do not finish on schedule. Anyone planning a doctorate needs to think seriously about age and timing.
- Expansion differs sharply by discipline. Master’s education is moving toward professional and applied training, while doctoral expansion is concentrated in science, engineering, and medicine.
- Faculty hiring still carries the demographic imprint of the 1999 university expansion. A retirement-driven vacancy window of perhaps 40,000 to 50,000 positions per year may appear, but delayed retirement could reduce how much of it is actually available.
- Current faculty growth mainly absorbs people into mid-level titles, roughly equivalent to one-fifth of each year’s doctoral graduates.
- For many academics, the title held at age 40-44 may effectively become the title held until retirement.
- Already, about half of doctoral graduates do not enter faculty positions. In the future, that share is likely to rise, so professional planning outside academia needs to begin earlier rather than later.