In material development and QC, one of the most important questions after environmental exposure is simple: how much has the color actually changed? In practice, that answer usually starts with a measured color difference value, then moves into a grading system that people can use in specifications, reports, and pass/fail decisions.
What often causes confusion is that ΔE and grey scale ageing grades are related, but they are not interchangeable in a simplistic way. The relationship depends on the evaluation standard being used, especially when instrument-based grading is involved.
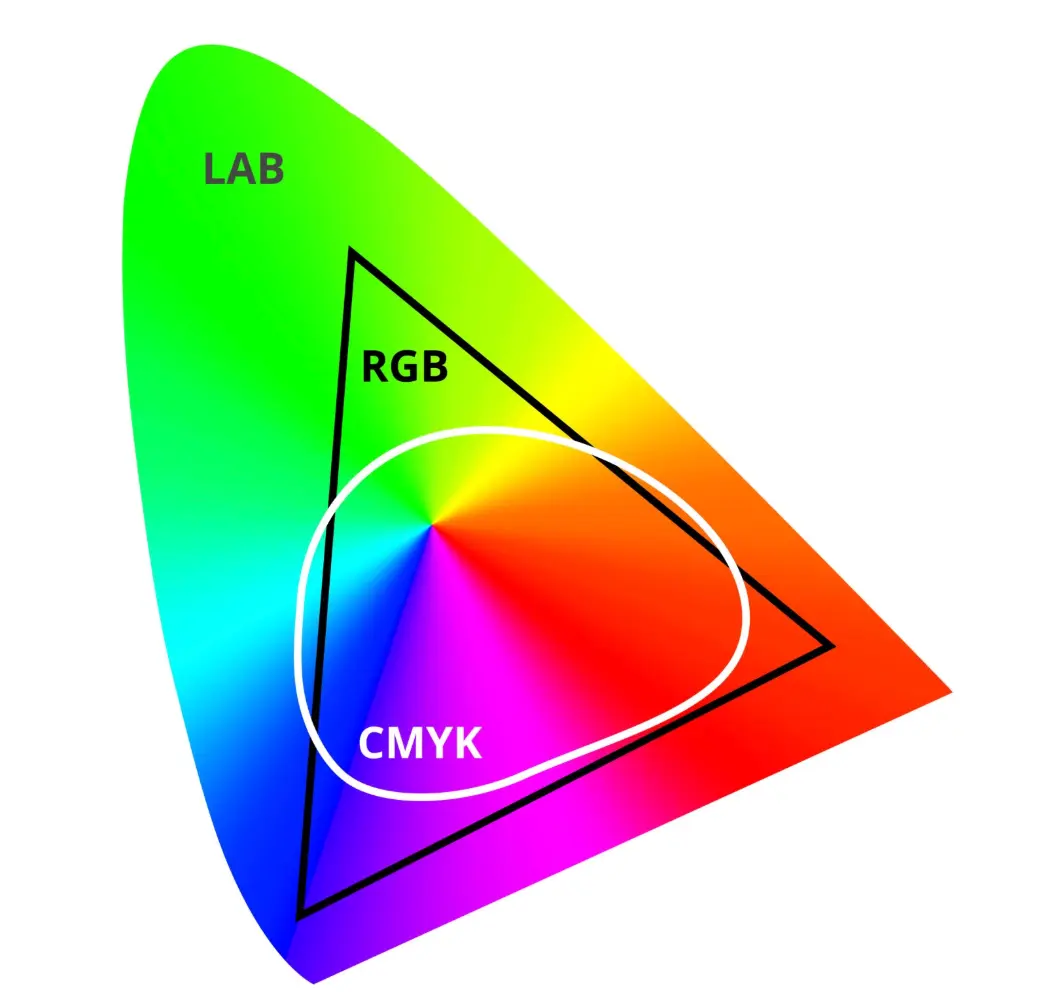
Color difference starts with the CIELAB system
For most weathering and color stability work, color is measured with a spectrophotometer and expressed as three CIELAB coordinates:
- L*: lightness
- a*: red–green axis
- b*: yellow–blue axis
The conventional color difference, ΔE*ab, is the Euclidean distance between two measured color points:
$$\Delta E^_{ab} = \sqrt{(\Delta L^)^2 + (\Delta a^)^2 + (\Delta b^)^2}$$
Its components are usually interpreted as follows:
- ΔL*: positive means the sample became lighter; negative means darker.
- Δa*: positive means a shift toward red; negative means a shift toward green.
- Δb*: positive means a shift toward yellow; negative means a shift toward blue.
This gives a quantitative basis for describing discoloration, but a raw ΔE number alone does not fully explain how that change is judged in standardized ageing reports.
Two parallel grading routes: visual grey scale vs instrumental grey scale
Change-in-color grading on the familiar 1 to 5 scale is commonly handled in two different ways: by visual assessment or by instrument calculation.
<table> <thead> <tr> <th>Aspect</th> <th>ISO 105-A02 (visual assessment)</th> <th>ISO 105-A05 (instrumental assessment)</th> </tr> </thead> <tbody> <tr> <td>Definition</td> <td>Grey scale for assessing change in colour</td> <td>Instrumental assessment of change in colour for determination of grey scale rating</td> </tr> <tr> <td>How it works</td> <td>Visual comparison under standard lighting against a physical grey scale</td> <td>Instrument-based calculation using spectrophotometric data and a defined conversion method</td> </tr> <tr> <td>Main tools</td> <td>Light booth, physical grey scale cards</td> <td>Spectrophotometer, software implementing the A05 algorithm</td> </tr> <tr> <td>Output</td> <td>Discrete grades: 1, 1-2, 2, 2-3, 3, 3-4, 4, 4-5, 5</td> <td>Continuous values such as 4.2, or rounded standard grades such as 4-5</td> </tr> <tr> <td>Objectivity</td> <td>Influenced by lighting conditions, observer vision, and human judgement</td> <td>Highly repeatable and less affected by human factors</td> </tr> <tr> <td>Typical use</td> <td>Quick qualitative checks, or textured/complex samples that are difficult to measure instrumentally</td> <td>R&D, precise benchmarking, and third-party reporting</td> </tr> </tbody> </table>Because current industrial practice relies heavily on instrumental testing, the more relevant framework for quantitative conversion is usually ISO 105-A05.
Why ISO 105-A05 matters
The full title of ISO 105-A05 is:
Textiles — Tests for colour fastness — Part A05: Instrumental assessment of change in colour for determination of grey scale rating
Although it originated in textiles, its logic is widely used in plastics, building products, composites, and other sectors that need a consistent way to express weathering-related color change.
Its purpose is not merely to report L*, a*, b* values. It converts measured chromatic data into a grey scale rating from 1 to 5, aligning instrumental data with human perception more reliably than a direct visual check.
The core logic is not just raw ΔE*ab
ISO 105-A05 does not rely on the simplest ΔE*ab value alone. Instead, it uses a modified color difference, often written as ΔE_F.
That modification matters because the human eye does not respond equally to every hue shift or chroma change. The standard applies a correction that better reflects perceptual sensitivity, then uses a logarithmic conversion to generate a continuous instrumental grade such as 4.2, which can then be rounded into the standard reporting categories such as 4-5.
In other words, the standard is doing more than table matching. It is translating measured color change into a grading scale meant to correspond more closely to what observers would perceive.
Practical ΔE thresholds associated with grey scale ratings
In routine laboratory and industrial use, the instrumental grading system is commonly represented by the following approximate ΔE boundaries. Minor differences may appear across standard revisions or implementations, but the following ranges reflect mainstream practice:
<table> <thead> <tr> <th>Grey scale rating (GS)</th> <th>ΔE range</th> <th>Interpretation</th> </tr> </thead> <tbody> <tr> <td>5</td> <td>$\Delta E \le 0.22$</td> <td>No visible difference</td> </tr> <tr> <td>4-5</td> <td>$0.22 < \Delta E \le 1.25$</td> <td>Extremely slight change</td> </tr> <tr> <td>4</td> <td>$1.25 < \Delta E \le 2.02$</td> <td>Slight change</td> </tr> <tr> <td>3-4</td> <td>$2.02 < \Delta E \le 2.89$</td> <td>Noticeable change</td> </tr> <tr> <td>3</td> <td>$2.89 < \Delta E \le 4.12$</td> <td>Clearly visible change</td> </tr> <tr> <td>2-3</td> <td>$4.12 < \Delta E \le 5.84$</td> <td>Severe change</td> </tr> <tr> <td>2</td> <td>$5.84 < \Delta E \le 8.23$</td> <td>Significant discoloration</td> </tr> <tr> <td>1-2</td> <td>$8.23 < \Delta E \le 11.64$</td> <td>Extremely severe discoloration</td> </tr> <tr> <td>1</td> <td>$\Delta E > 11.64$</td> <td>Drastic color change</td> </tr> </tbody> </table>These ranges explain why a result may appear stricter or more lenient than simplified charts seen in sales materials or internal references. A common oversimplification is to treat 4-5 as if it ends at ΔE = 1.0, but instrumental grading in actual lab practice often extends that upper boundary to around 1.25.
Why the instrumental route is preferred in development and reporting
ISO 105-A05 offers several practical advantages:
- Objectivity: it removes variation caused by observer fatigue, color weakness, or inconsistent visual judgement.
- Higher precision: instead of limiting the result to half-grade steps visible by eye, it can provide a continuous numerical grade before rounding.
- Inter-lab consistency: it helps laboratories in different locations use the same decision logic when reporting change in color.
That consistency is one reason instrumental grey scale ratings are widely accepted in formal weathering reports.
Interpreting a real report result: why ΔE = 1.14 can still be rated 4-5
Consider an accelerated weathering report for an outdoor wood-plastic composite decking product tested under xenon arc exposure.
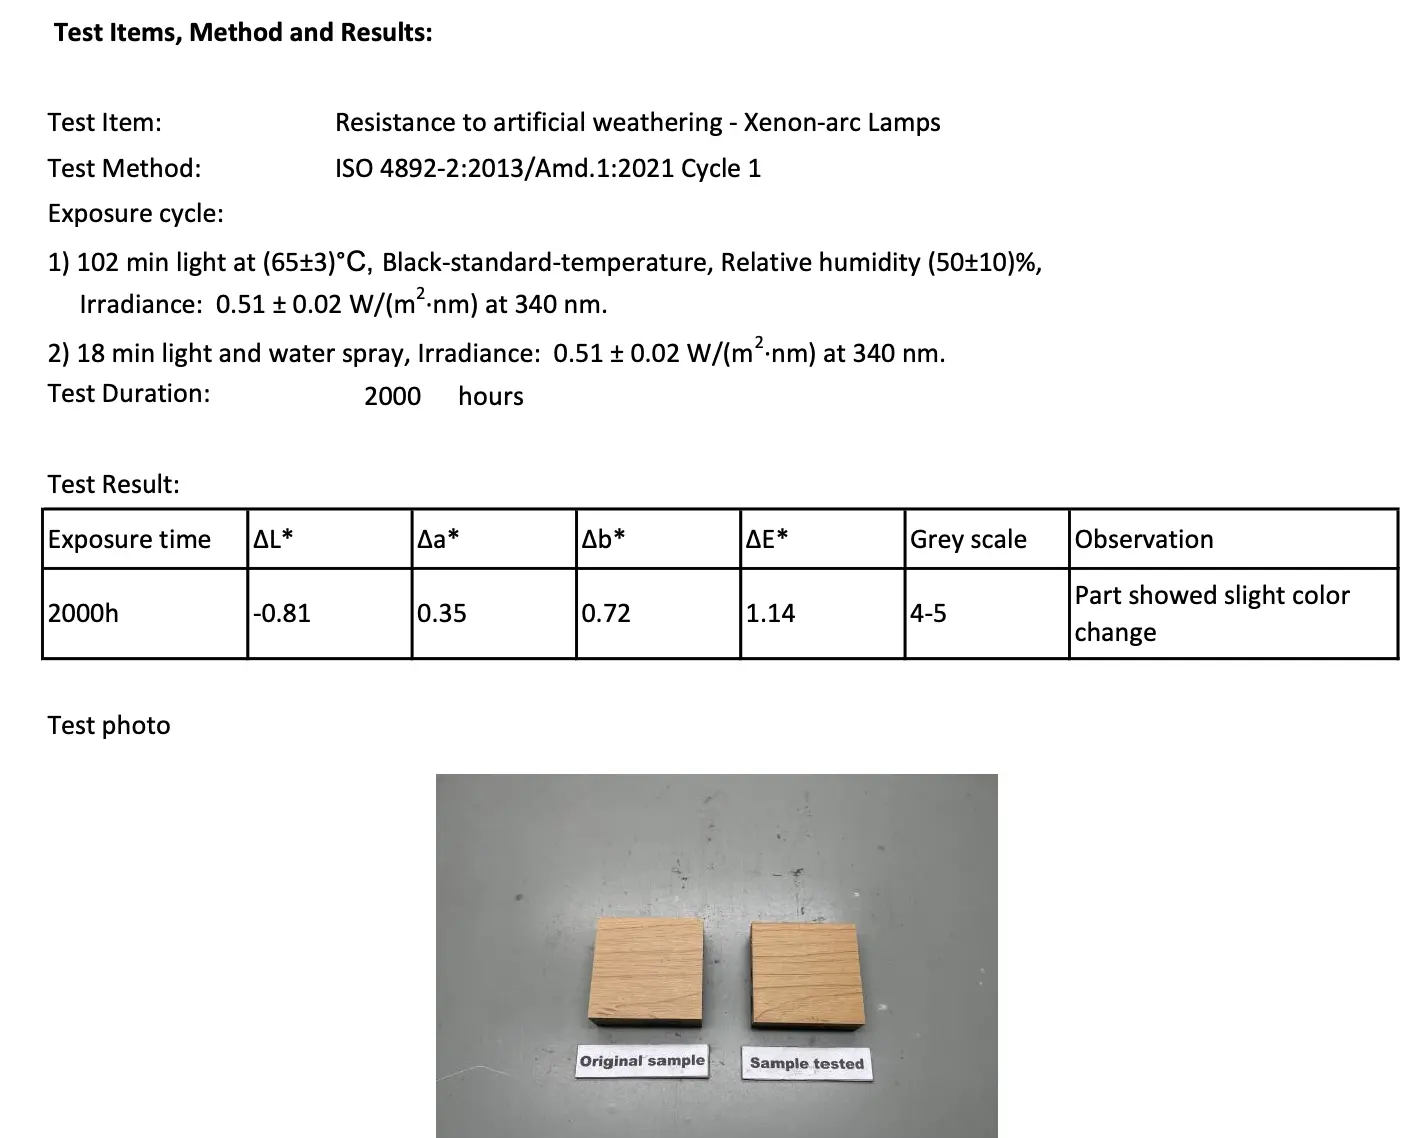
The key reported values are:
- Test object: outdoor WPC decking board
- Method: ISO 4892-2:2013/Amd.1:2021, Cycle 1, xenon arc exposure
- Test duration: 2000 hours
- Measured color difference: ΔE* = 1.14
- Grey scale rating: 4-5
At first glance, some readers expect 1.14 to be too high for 4-5. Technically, that expectation is not necessarily correct.
Why the 4-5 rating is defensible
1. The conversion interval used in instrumental grading is broader than simplified charts suggest
In practical testing, grey scale conversion generally follows the ISO 105-A05 instrumental logic. Under this approach, the upper limit for 4-5 commonly extends to around ΔE = 1.25 rather than being cut off at 1.0.
That means 1.14 falls within the accepted 4-5 zone.
2. The visual observation supports only slight change
The report observation notes that the part showed slight color change. That description is consistent with the definition of a 4-5 result, which corresponds to very slight to slight discoloration rather than a clearly obvious shift.
3. Software-based grade conversion can produce a continuous result that rounds to 4-5
Laboratories using calibrated spectrophotometer software do not usually assign the grade by eyeballing a threshold chart. The software calculates a continuous grade from the measured data. If the result is closer to 4.5, it is then reported as 4-5.
So a measured ΔE* = 1.14 and a reported grey scale rating of 4-5 are fully consistent with standard instrument-based practice.
What the result says about weathering performance
For WPC or similar composite decking materials, a color difference of only 1.14 after 2000 hours of xenon arc exposure indicates a very strong level of UV and weathering resistance.
The directional color shifts are also limited:
- ΔL* = -0.81
- Δa* = 0.35
- Δb* = 0.72
That pattern suggests:
- slight darkening,
- a very small shift toward red,
- a very small shift toward yellow.
In other words, the material did not undergo dramatic fading or severe chromatic distortion. The change remained controlled and relatively uniform.
Can 2000 hours of accelerated ageing be converted into outdoor service years?
This is one of the hardest questions in reliability engineering, and there is no universal fixed conversion ratio.
Still, a logical estimate can be made using the concept of equivalent total radiant exposure. The idea is to compare the UV energy delivered in the laboratory with the annual solar UV energy a product would receive in different geographic climates.
Estimating equivalent outdoor exposure using UV dose
1. Laboratory radiant exposure
The reported test condition uses an irradiance of:
- 0.51 W/(m²·nm) at 340 nm
with a total exposure time of:
- 2000 h
Using the basic energy relation:
- H_lab = E · t
Under the ISO 4892-2 test framework, this irradiance corresponds to a total UV irradiance in the 300–400 nm range of about:
- 60 W/m²
So the total UV dose over 2000 hours is approximately:
- 60 W/m² × 2000 h = 120,000 Wh/m² = 432 MJ/m²
That 432 MJ/m² becomes the basis for comparing the test to different outdoor environments.
2. Approximate annual UV dose in different regions
Because ambient UV intensity differs greatly by climate and latitude, the same 432 MJ/m² lab dose can correspond to very different lengths of outdoor exposure.
<table> <thead> <tr> <th>Region (annual UV exposure)</th> <th>Outdoor years equivalent to 432 MJ/m²</th> <th>Climate profile</th> </tr> </thead> <tbody> <tr> <td>Florida / Arizona (~280–330 MJ/m²)</td> <td>1.3–1.5 years</td> <td>Extremely high UV, hot-humid or hot-dry</td> </tr> <tr> <td>South China (e.g. Shanghai / Guangzhou) (~200–240 MJ/m²)</td> <td>1.8–2.2 years</td> <td>Medium-to-high UV intensity</td> </tr> <tr> <td>Central / Northern Europe (~100–140 MJ/m²)</td> <td>3.1–4.3 years</td> <td>Lower UV intensity</td> </tr> </tbody> </table>So if the material still shows only ΔE = 1.14 after a lab UV dose roughly comparable to around 2 years of South China exposure, that is a strong sign of color stability.
Why energy equivalence is only the starting point
Radiant exposure alone does not equal actual service life. Several acceleration factors affect how well a laboratory test represents real outdoor performance.
Temperature factor
The report uses a black standard temperature of about:
- (65 ± 3)°C
If the actual installation environment runs cooler on average, degradation in service may proceed more slowly than it does in the chamber.
Moisture and water spray cycles
The xenon exposure cycle includes:
- 18 minutes of water spray per cycle
This matters because weathering damage is not caused by light alone. Rain, condensation, thermal shock, and hydrolysis can significantly contribute to surface degradation. For systems such as polyurethane coatings or WPC decking, moisture-driven stress cracking can be more destructive than radiation by itself.
Material degradation threshold
A result of ΔE* = 1.14 with a 4-5 grey scale rating means the material remains in the range of extremely slight discoloration even after harsh combined exposure.
Extrapolation method
If one assumes linear degradation—which in reality is often not the case—then reaching a grade 3 level, where color change becomes clearly noticeable, could require more than 8000 hours. That estimate should be treated cautiously, because color change often follows a nonlinear path over time.
Industry rule-of-thumb for outdoor decking and building materials
In the WPC building product and outdoor coating sectors, a rough engineering reference is often used:
- 1000 hours of xenon arc ageing under ISO 4892-2 is often treated as roughly corresponding to about 1 year of outdoor performance in a moderate climate.
Using that rule of thumb, a product that reaches 2000 hours while still maintaining a 4-5 rating would usually be regarded as having a very high likelihood of showing no significant visible discoloration for about 3 to 5 years in real outdoor use.
That is not a guaranteed warranty life, but it is a meaningful engineering indicator.
What can and cannot be claimed from this kind of data
The test data support a strong conclusion: the material has an excellent basis for long-term weather resistance, at least in terms of color retention under accelerated exposure.
At the same time, laboratory ageing cannot fully reproduce all outdoor variables, including:
- atmospheric pollutants,
- acid rain,
- ozone,
- daily thermal cycling,
- long-term physical fatigue from real service conditions.
Because of that, technical communication should be phrased carefully. A more rigorous statement is not to promise a fixed number of years outright, but to say something like:
After 2000 hours of artificial accelerated weathering, corresponding to the radiant exposure of approximately X years in a specified region, the measured color difference remained within 1.14.
That type of wording is more precise, more defensible, and more aligned with how weathering data should be interpreted in engineering and compliance contexts.